Madrid in numbers

The 2026-27 season

Where Real Madrid stand in 2026-27: league position, points, goals for and against, with the source and date of every figure. The key matches below link to the analysis behind them, and the page is updated as the season goes on.

Sample data

The figures are real and sourced; the key matches below are still sample data. They show the format and will be replaced with real matches and charts as the season goes on.

The numbers

  • League position 3rd La Liga, after 10 matches
  • Points 24 8 wins, 0 draws, 2 losses
  • Goals scored 25 In 10 La Liga matches
  • Goals conceded 10 Goal difference +15

Last updated

Source: skysports.com (opens in a new tab)

Key matches

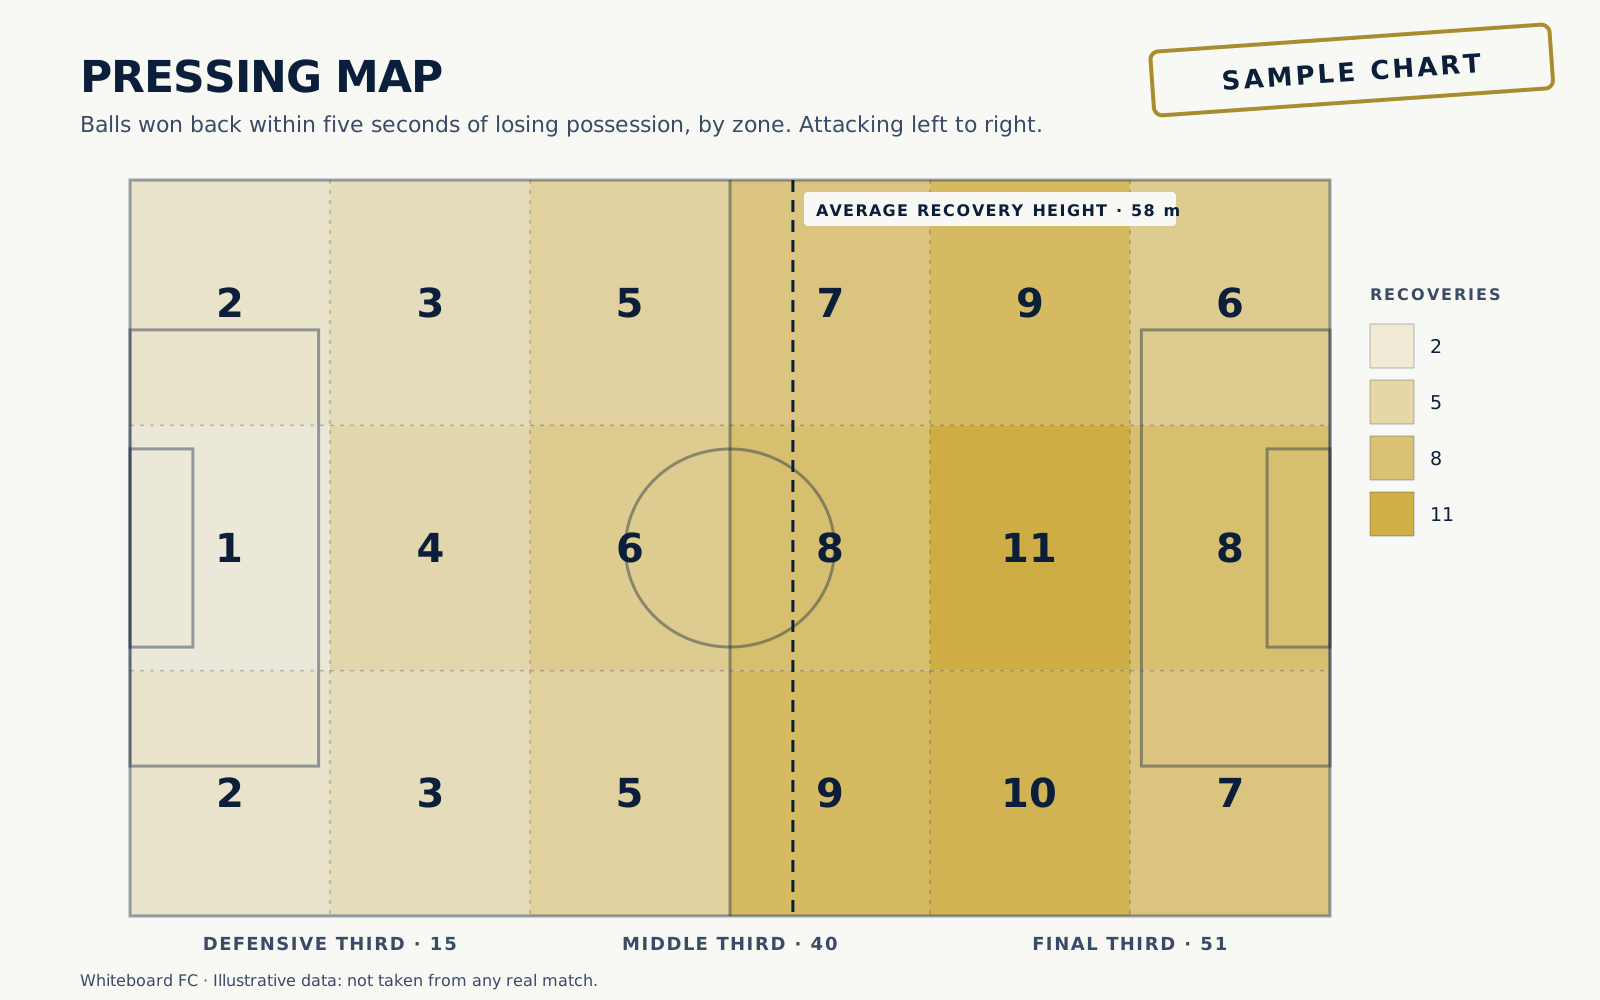
  1. Sample pressing map: the pitch split into zones, with more ball recoveries in the opponent’s third than in Madrid’s own.

    La Liga

    Sample opponent A

    Opening weekend: the high press as the starting point

    Sample data
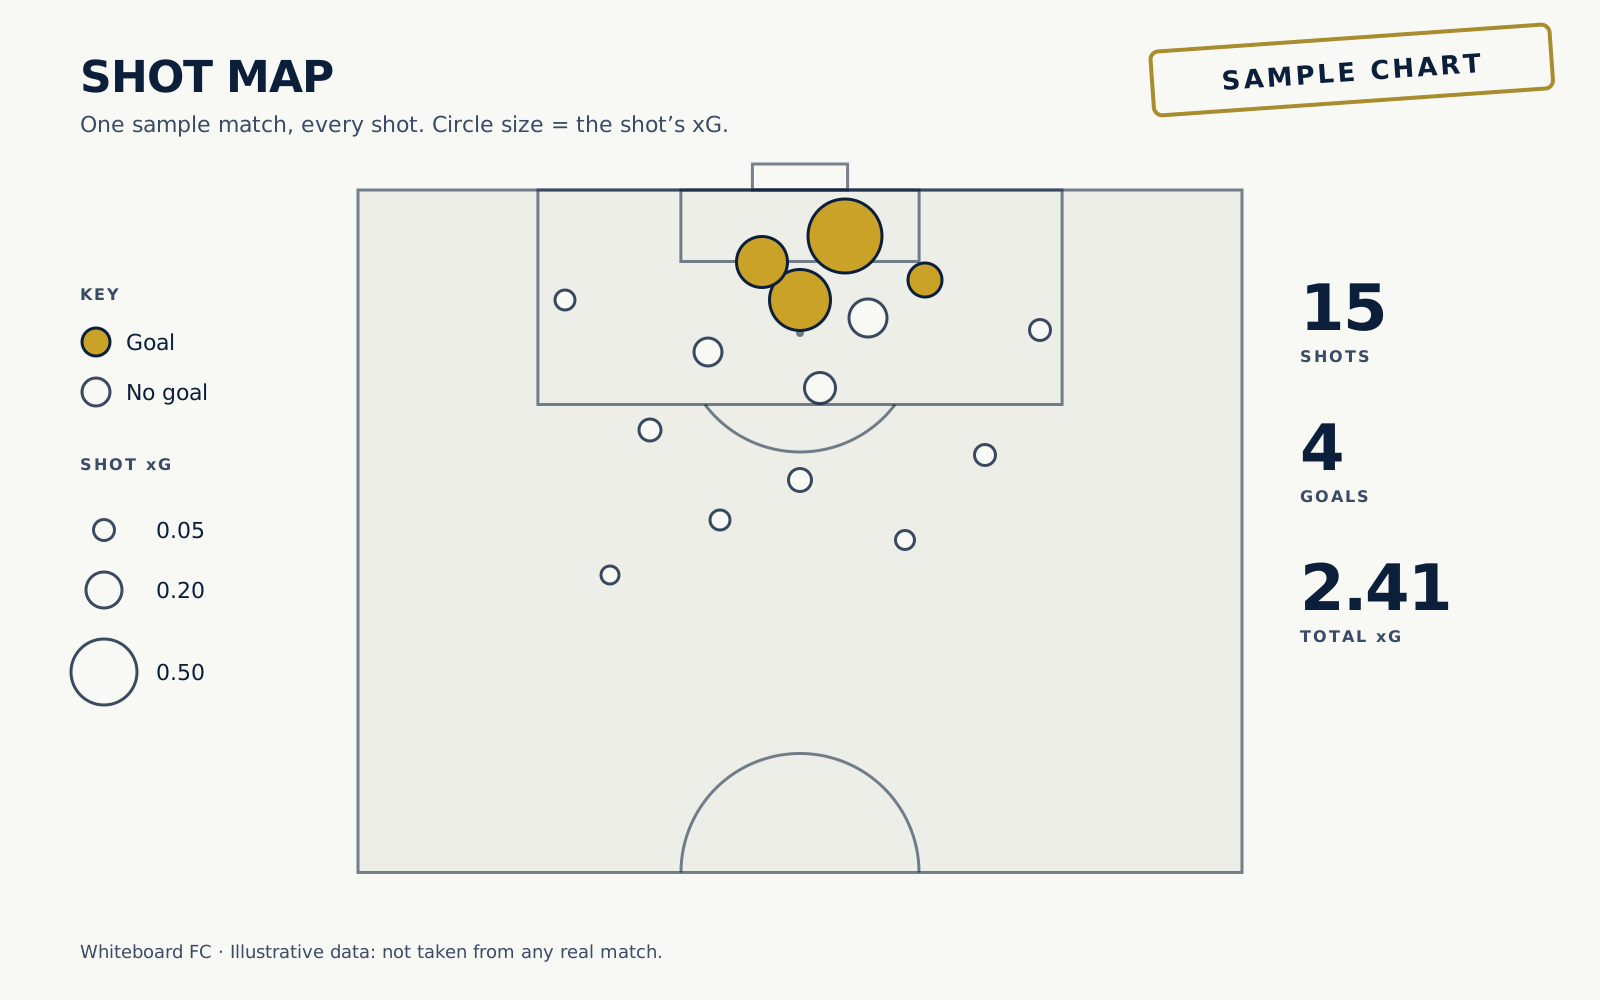
  2. Sample shot map on half a pitch: most shots come from inside the box, and the four goals, in gold, from close to the six-yard box.

    La Liga

    Sample opponent B

    Shots from inside the box, and very few from distance

    Sample data
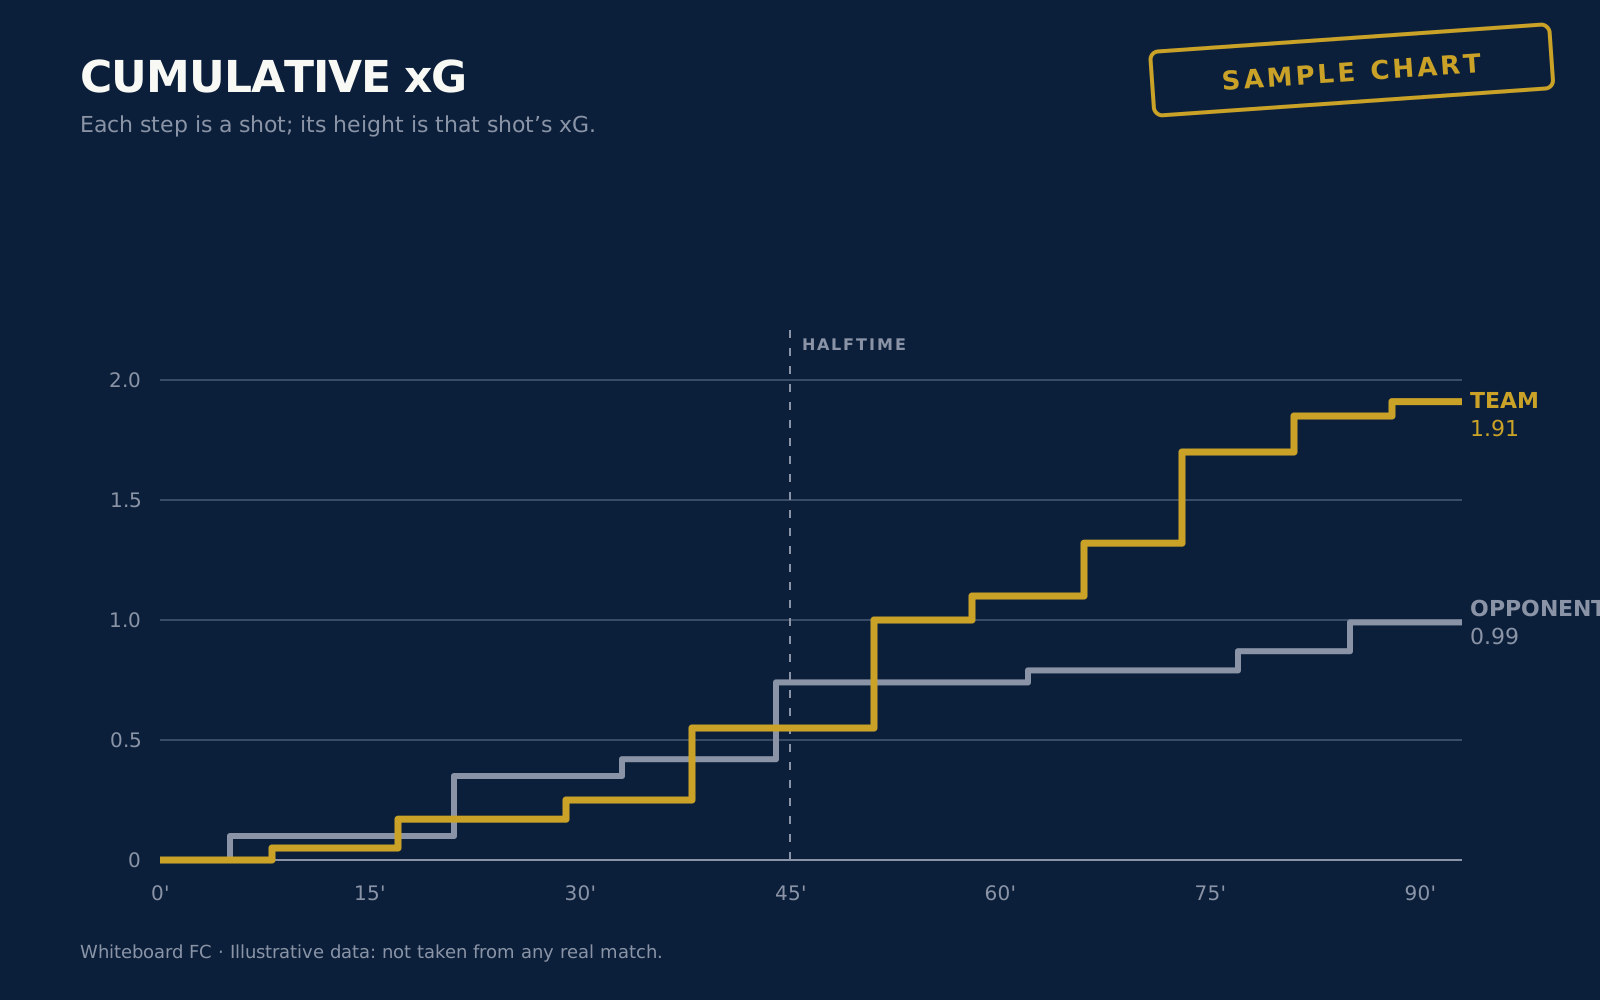
  3. Sample cumulative xG curve: the two teams are level until halftime, then the gold team pulls clear in the second half.

    Champions League

    Sample opponent C

    A match decided in the second half

    Sample data
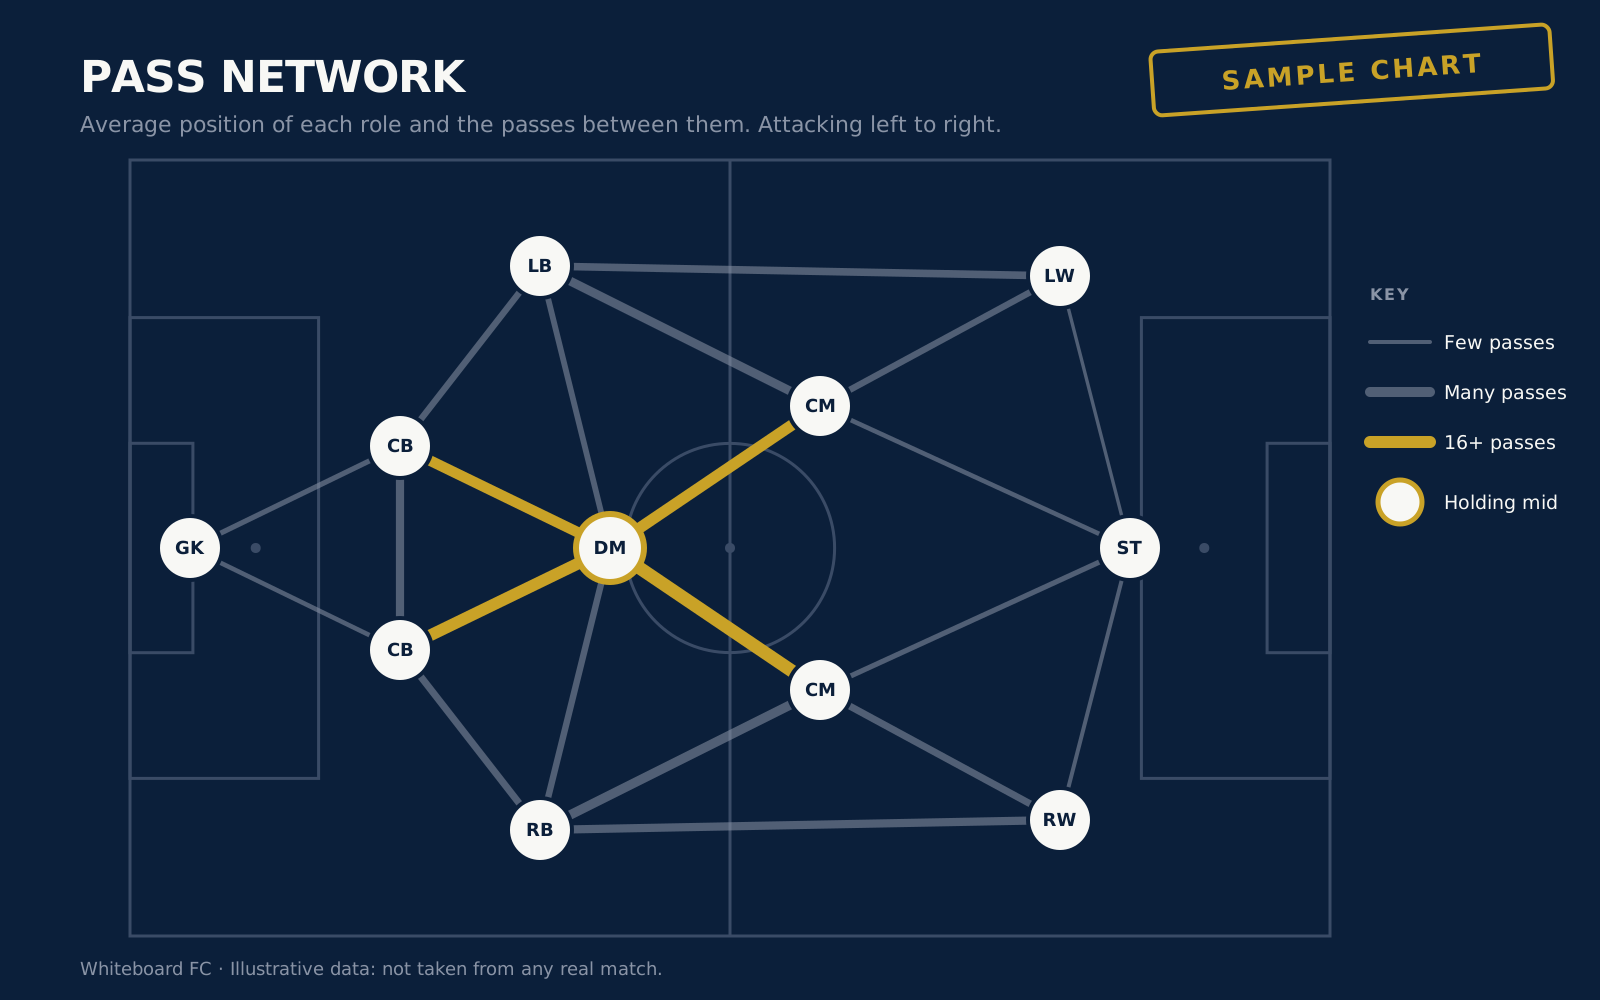
  4. Sample pass network: eleven positions joined by lines whose thickness shows the number of passes; the thickest links all run through the holding midfielder.

    La Liga

    Sample opponent D

    The midfield, seen through the pass network

    Sample data
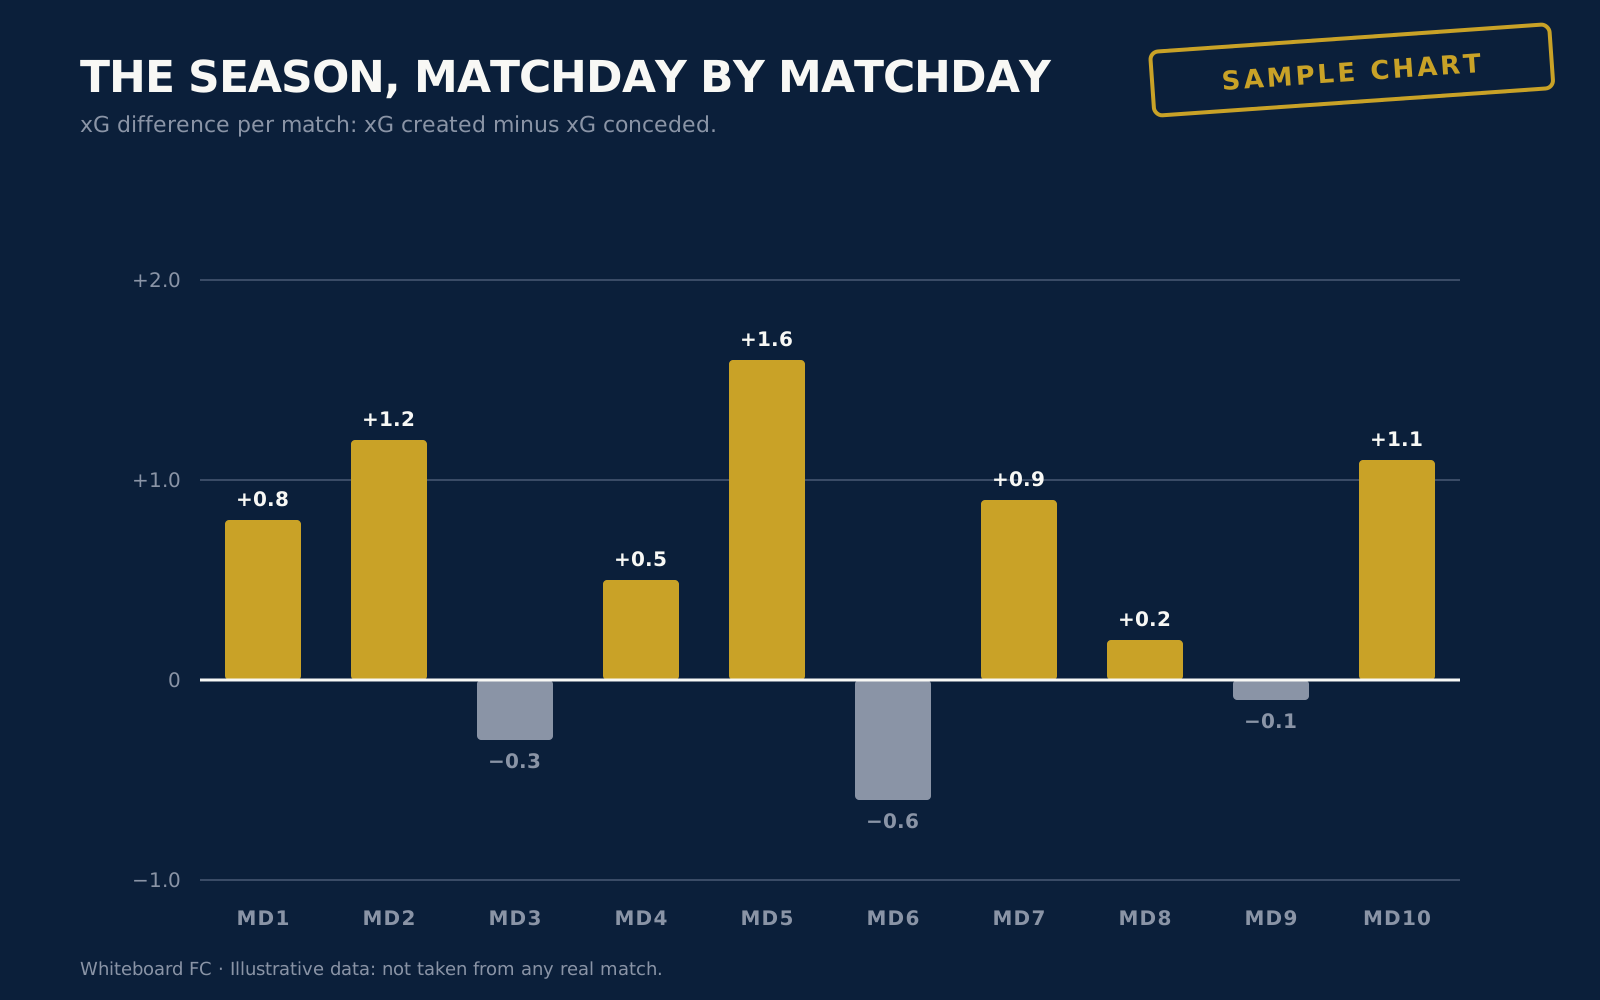
  5. Sample bar chart of xG difference over ten matchdays: seven gold bars above zero and three gray bars below.

    La Liga

    Sample opponent E

    Ten matchdays of expected-goal difference

    Sample data